When we look at maps of battles even the novice armchair general can quickly trace the battle lines of the armies. Recognizing battle lines is one of the most important skills a commander – or a wargaming Artificial Intelligence (AI) – can possess. Without this ability how will you identify the flanking units? And if you can’t identify the units at the end of a line, how will you implement a flanking attack around them? Equally important is the ability to identify weak points in a battle line.
The algorithm for detecting battle lines and flank units is one of the ‘building block’ algorithms of my TIGER / MATE tactical AI and first appeared in my paper, Implementing the Five Canonical Offensive Maneuvers in a CGI Environment1)http://riverviewai.com/papers/ImplementingManeuvers.pdf. I will discuss how the algorithm works at the end of this blog. For now, just accept that it finds lines and flanks.
Let’s look at some examples of the General Staff AI ‘parsing’ unit positions. First, the battle of Antietam, situation at dawn (by the way, Antietam is one of the free scenarios included with the General Staff Wargaming System):
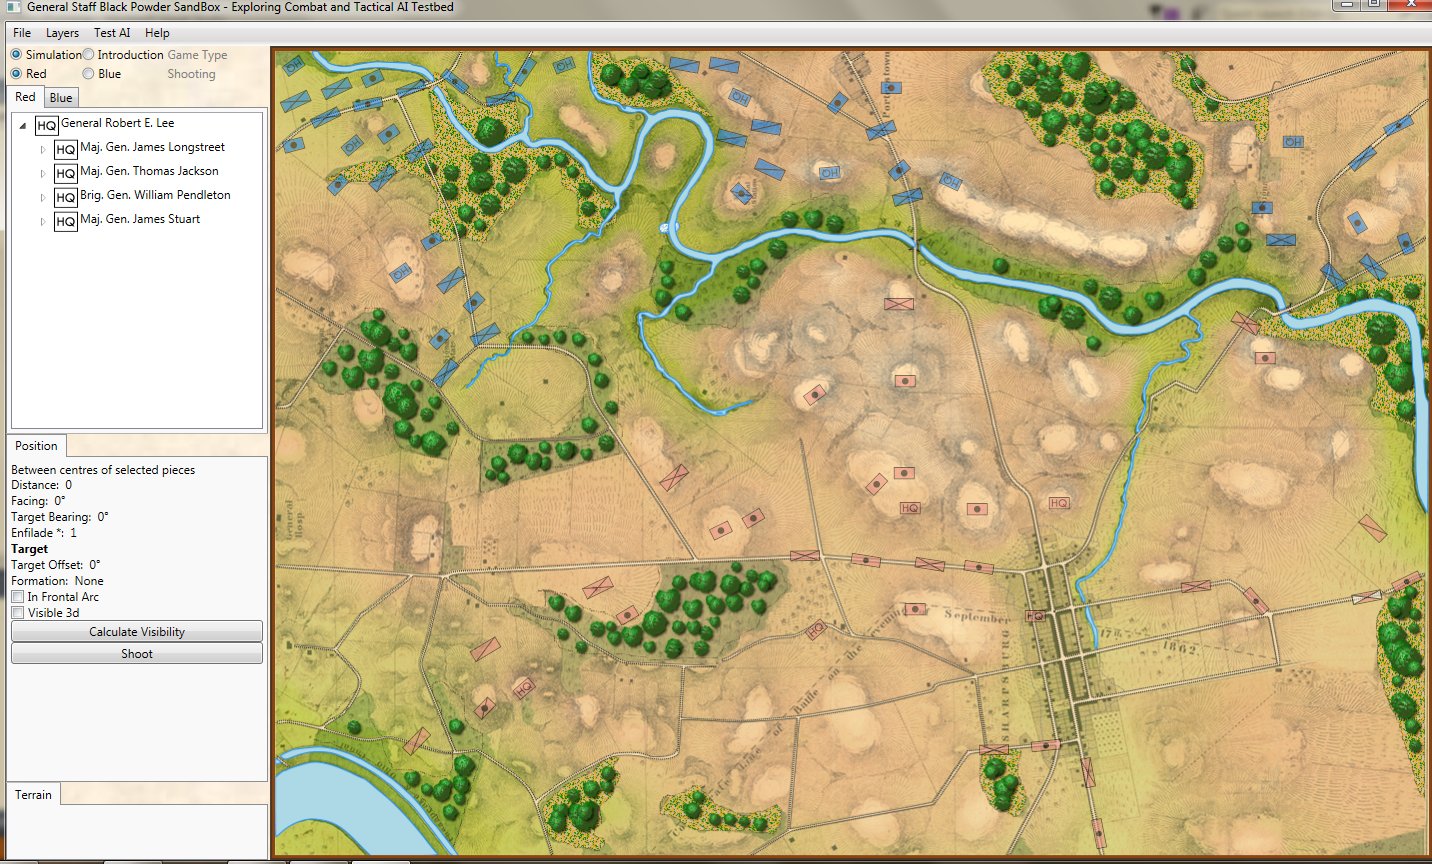
The battle of Antietam, dawn, September 17, 1863. Screen shot from the General Staff Sand Box program. Click to enlarge.
This is how a human sees the tactical situation: units on a topographical map. But, the computer AI sees it quite differently. In the next image, below, the battle lines and elevation are displayed as the AI sees the battle (note: the AI also ‘sees’ the terrain but, for clarity, that is not being shown in this screen capture):
The battle of Antietam, September 17, 1862 dawn, with computer AI battle lines and elevation displayed. Note: the identification of flank units. Both red and blue forces are assembling on the field. Click to enlarge.
What is immediately obvious is that Red (Confederate) forces are hastily constructing a battle line while Blue (Union) forces are beginning to pour onto the battlefield to attack. Let us now ask the question: what is the weakest point of the Red battle line? Where should Blue attack? This point is sometimes called the Schwerpunkt. German for point of maximum effort2)See also, “Clausewitz’s Schwerpunkt Mistranslated from German, Misunderstood in English” Military Review, 2007 https://www.armyupress.army.mil/Portals/7/military-review/Archives/English/MilitaryReview_20070228_art014.pdf. Where should Blue concentrate its forces?
Computer AI representation of battle lines for Antietam, dawn September 17, 1862. The AI is locating the Schwerpunkt or place to attack. Click to enlarge.
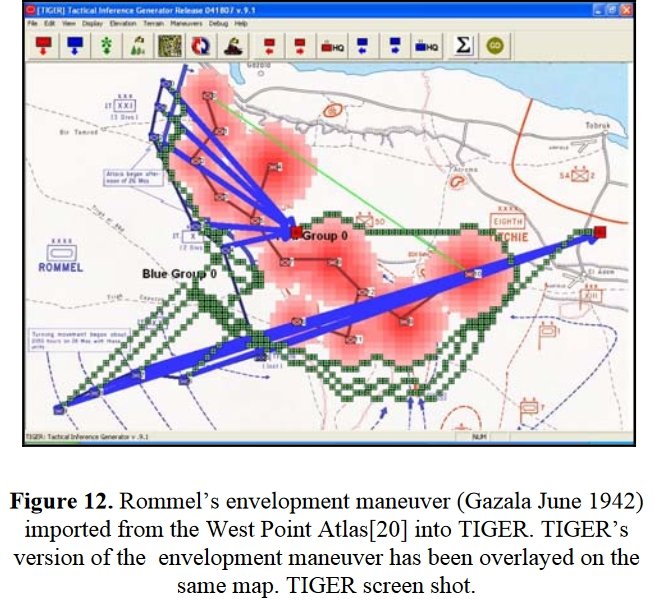
Now that the weakest points of Red’s battle line have been identified, Blue (assuming Blue is being controlled by the AI) can exploit it by attacking the gaps in Red’s battle line. The Blue AI can order either a Penetration or Infiltration Maneuver to exploit these gaps (the following images are from my paper, “Implementing the Five Canonical Offensive Maneuvers in a CGF Environment.” Note, in the TIGER / MATE screen shots below Range of Influence (ROI) is also visible:
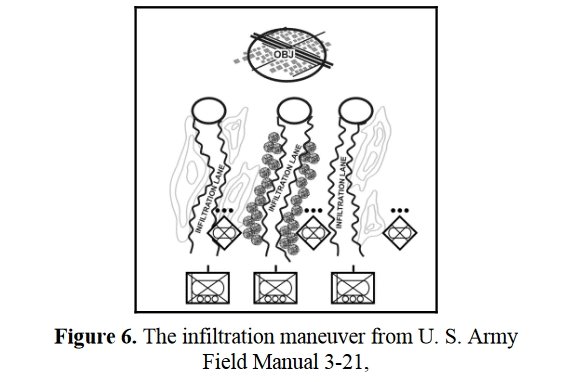
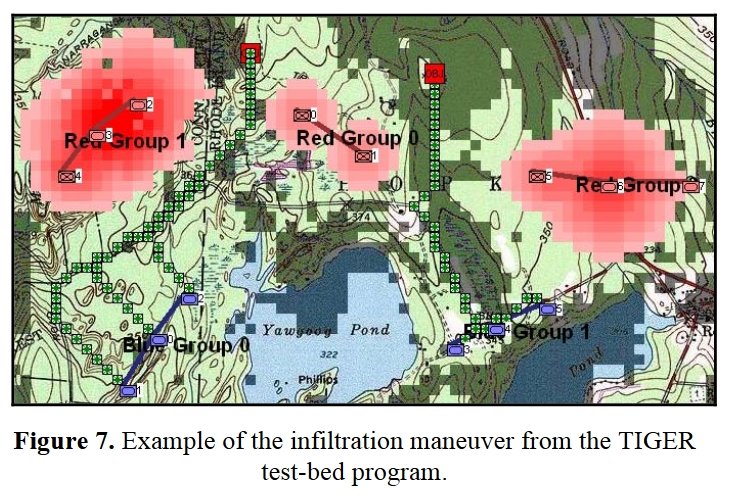 Both of these maneuvers are possible because the AI has identified weak points in the OPFOR (Opponent Forces) battle lines. Equally important when discussing battle lines are the location of the flanks. The next two images use the original American Kriegsspiel (1882) map which is also included in the General Staff Wargaming System:
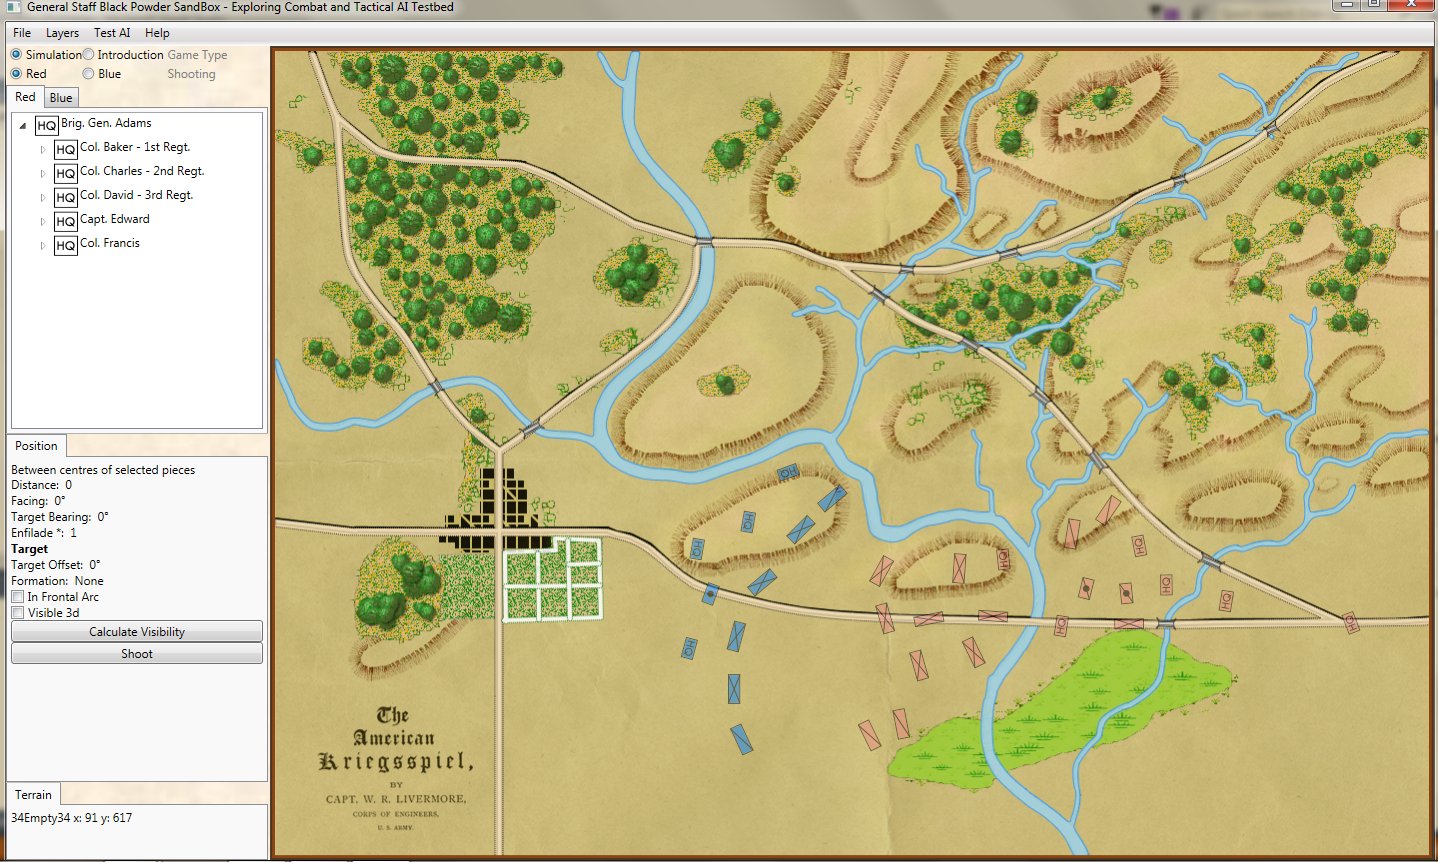
The original American Kriegsspiel map (1882) restored and now used in the General Staff Wargaming System. Screen shot from the General Staff Sand Box AI test program. Click to enlarge.
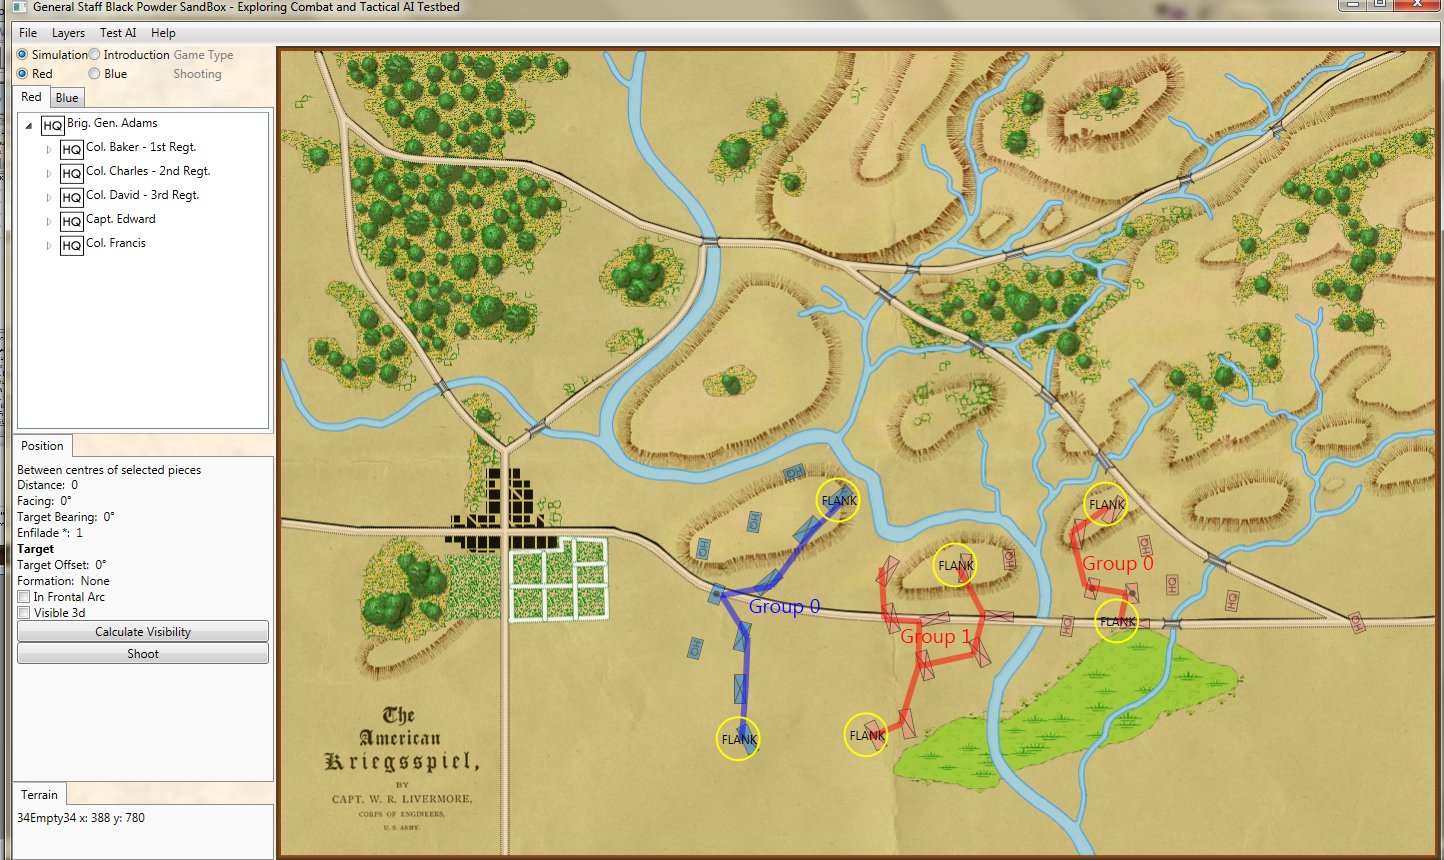
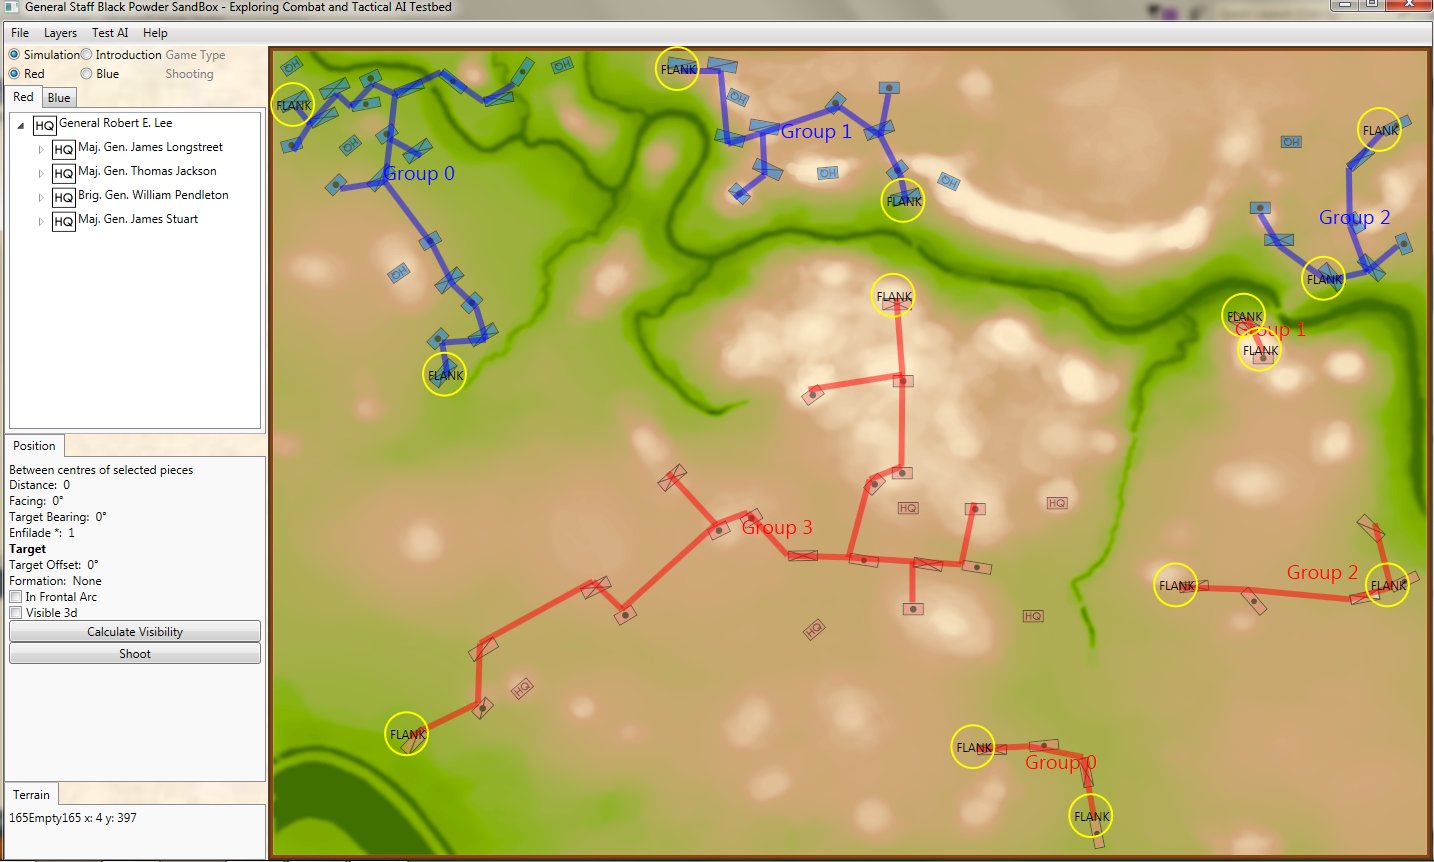
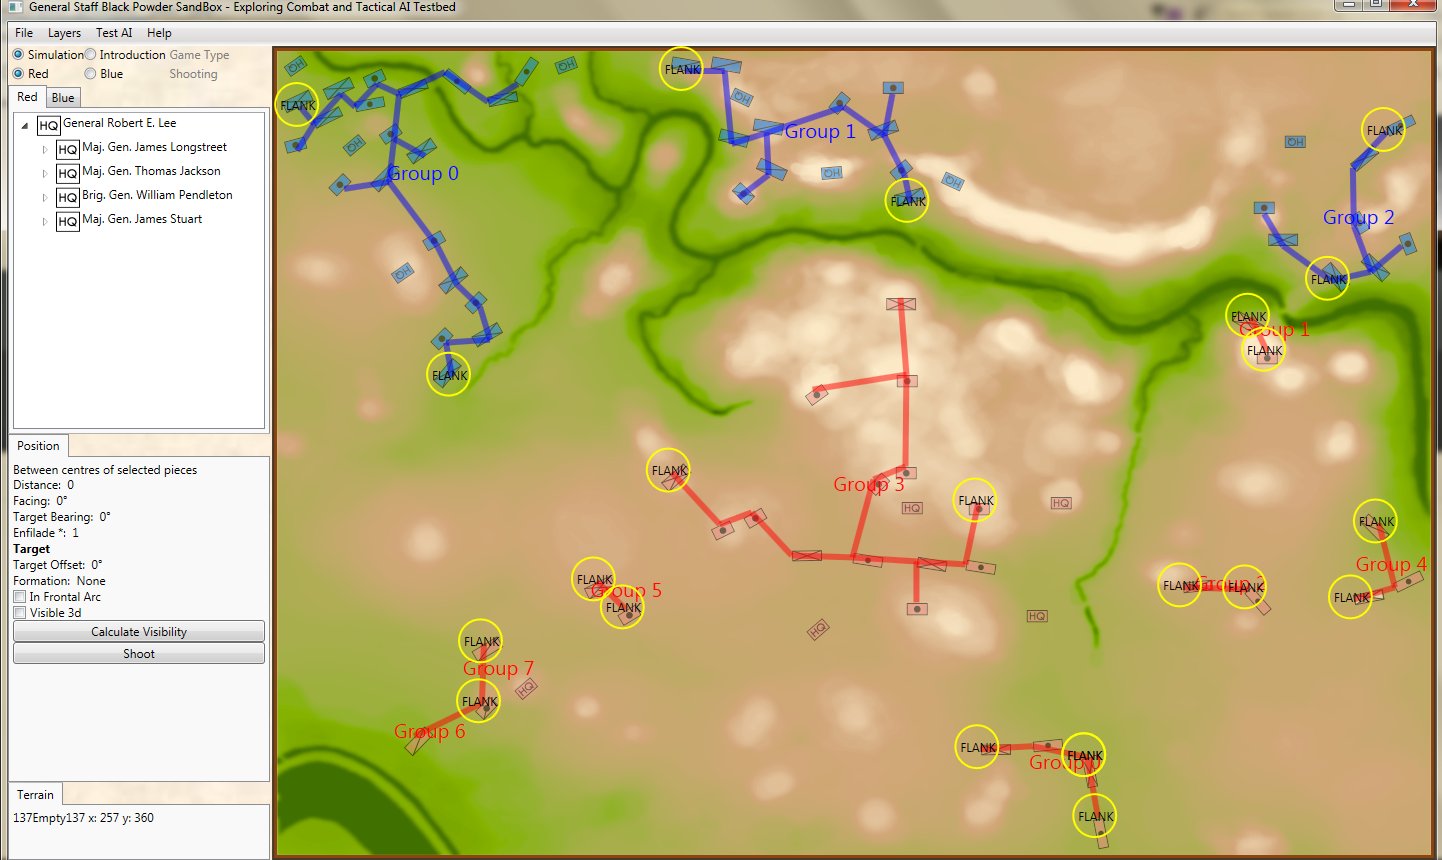
In this screen capture from the General Staff Wargaming System Sand Box AI test program battle lines are displayed by the AI. Note the flank units and especially the unanchored (or open) Blue flank. Click to enlarge.
Identifying flank units is vitally important in the Turning Maneuver and the Envelopment Maneuver:
Knowing the location of flank units is also important for classifying tactical positions (this will be the subject of an upcoming blog).
So, how does this algorithm work?
I’ve never been a fan of graph theory; or heavy mathematical lifting in general. One of the required classes in grad school was Design and Analysis of Algorithms and it got into graph theory quite a bit. The whole time I was thinking, “I’m never going to use any of this stuff, but I have to get at least a B+ to graduate,” so I took a lot of notes and studied hard. Later, when I was looking for a framework to understand tactics and to write a tactical AI it became obvious that graph theory was at least part of the solution. Maps are routinely divided into a grid, unit locations can be points (or vertices) at the intersections of these lines. Battle lines can be edges that connect the vertices. I need to publicly thank my doctoral advisor, Dr. Alberto Segre, for first suggesting that battle lines could be described using something called a Minimum Spanning Tree3)https://en.wikipedia.org/wiki/Minimum_spanning_tree (MST). An MST is the minimum possible distances (edge weights to be precise) to connect all the vertices in a tree (or a group, as I call them in the above screen shots).
I ended up implementing Kruskal’s algorithm4)https://en.wikipedia.org/wiki/Kruskal’s_algorithm for identifying battle lines. It is what is called a ‘greedy algorithm’ and it runs in O(E log V) which means it gets slower as we add more units but we’re never dealing with gigantic numbers of individual units in an Order of Battle (probably around 50 is the maximum) so it takes less than a second to calculate and display battle lines for both Red and Blue.
Lastly, and I guess this is my contribution to military graph theory, I realized that the flank units of any battle line must be the maximally separated units. That is to say, that the two units in a battle line that are the farthest apart are the flank units.
 Obviously, this is a subject that I find fascinating so please feel free to contact me directly if you have any questions or comments.
References
| ↑1 | http://riverviewai.com/papers/ImplementingManeuvers.pdf |
|---|---|
| ↑2 | See also, “Clausewitz’s Schwerpunkt Mistranslated from German, Misunderstood in English” Military Review, 2007 https://www.armyupress.army.mil/Portals/7/military-review/Archives/English/MilitaryReview_20070228_art014.pdf |
| ↑3 | https://en.wikipedia.org/wiki/Minimum_spanning_tree |
| ↑4 | https://en.wikipedia.org/wiki/Kruskal’s_algorithm |


